15 Benefits of Google Analytics
PUBLISHED:
Jul 11, 2024
Wondering why you should be using Google Analytics? I can think of about 20 reasons off the top of my head why Google Analytics (and particularly GA4) is such a great tool, helping website owners measure their website performance and understand what works with their marketing.
In this article, I cover 14 of those benefits and give you a taste of what you can measure using the free tool.
First, let's dive into what you can measure with Google Analytics.
Why measure your website metrics?
I want to emphasize how important it is to be using some sort of analytics tool or software to measure your website metrics. From Google Analytics to Hotjar and Fathom, there are a number of options for measuring your traffic.
Google Analytics has historically been the gold standard for tracking website engagement and performance, no matter if that website is a blog, consultant portfolio, e-commerce store, or non-profit website.
If you can’t measure it, you can’t manage it.
This is one of my favorite phrases in the online world, because it’s true.
Wondering what traffic sources perform best? When your best times of year are? What pages result in the most conversions?
These are all questions analytics can answer. And without analytics, you are shooting in the dark.
15 Benefits of Google Analytics
There are benefits of Google Analytics that boil down to understanding your audience and understanding what works with your website traffic. Using Google Analytics can help you understand your website and your users on a deeper level.
But really, those benefits are driven by the things that GA can measure. Here is an overview of just 15 of those benefits, including website engagement and user metrics you can measure, and different capabilities and features that Google Analytics 4 provides.
See how many visitors are on your website right now
Google Analytics 4 has a “Realtime overview” report, which will tell you exactly how many users have been on your website in the last 30 minutes.
This report will also tell you which countries those visitors are in, what content they’re viewing, and what Events they’re triggering.

See how many users you’re getting
In the default Acquisition reports, you’ll see how many users your website has seen. These reports can give you helpful information on traffic trends over time.

Learn where new users are coming from
Want to know exactly how your newest visitors are finding you? This is another metric found in your acquisition reports. This can help you decide what is really working right now, and historically, to help users find your website.

Learn how engaged your visitors are, filtered by any dimension you like
Wondering if your visitors are more engaged from social media or email? From Facebook or Instagram? Simply check out your engagement reports.
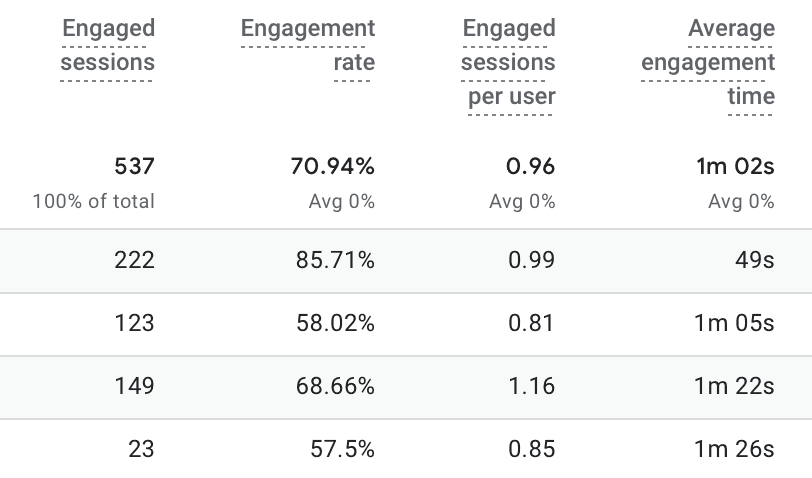
Learn about Google Analytics terminology by hovering over dash-underlined words
Ever wonder exactly what a metric or dimension means? Oftentimes, in the Google Analytics 4 dashboard, you’ll see phrases with dashed underlines. Just hover over the word to find out its definition. As we can see here, Engaged sessions are the sessions that have lasted longer than 10 seconds, have had an event marked as a conversion, or had 2+ page views.

Discover how “sticky” your user engagement is with User Stickiness
This is a new metric in GA4, that according to Google, says “User stickiness compares engagement by active users over a narrower time frame with their engagement over a broader time frame. The ratios can help you understand how well you retain users over time — higher ratios suggest good engagement and user retention.”

Learn what events are happening most frequently on your site
The event reports will tell you exactly how users are interacting with your website.

Likewise, find out what conversions happen on your website, and when
In Google Analytics 4, “Conversions” are just “Events” that have been marked as Conversions in your account settings.
In the Conversions report, you can see all of the details your heart desires about which Conversions are happening on your website the most.

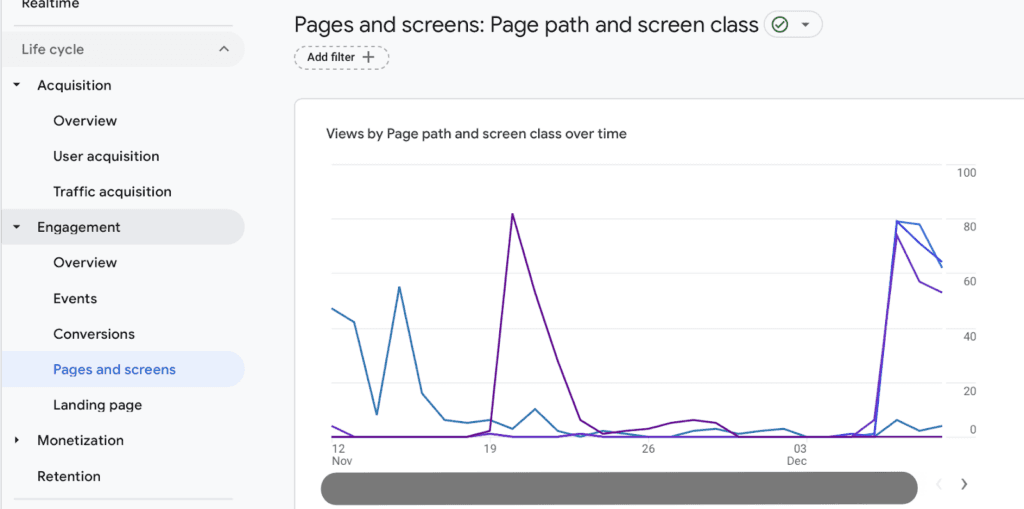
Discover which pages are your most visited, and which are most landed on
Want to know what your most visited content is? You’ll find that report here.
Discover extensive purchase analytics, including which products were bought and when
If you sell products on your website or use funnels, definitely use the Google Analytics ecommerce tracking to find out what sells best, how valuable your visitors are, and more.

Learn about your returning users
How well does your website bring users back? That’s what you can discover in the Retention dashboard.

Discover search metrics like which keywords you’re showing up for and which pages get search traffic
Have you set up Google Search Console? Once you do, simply connect it to your Google Analytics 4 account, and you’ll get access to a ton of useful search data.
This can help you decide which topics to focus on for new content, or which current popular content should be optimized further.

Create completely custom dashboard sections and reports
If you’re noticing that your Google Analytics dashboard has different labels than mine, they could be customized by your analytics expert or by the onboarding questions you went through when setting up your account. The coolest part? All of these sections (and the reports within them) are completely customizable. This is a major difference between Universal Analytics and Google Analytics 4.

Ask “Analytics Intelligence” questions about specific metrics questions
If you can't find a specific report, you can simply use the "Insights" tool to write out a question, and Google Analytics will do its best to answer you.It also provides pre-selected question prompts for you to choose from.

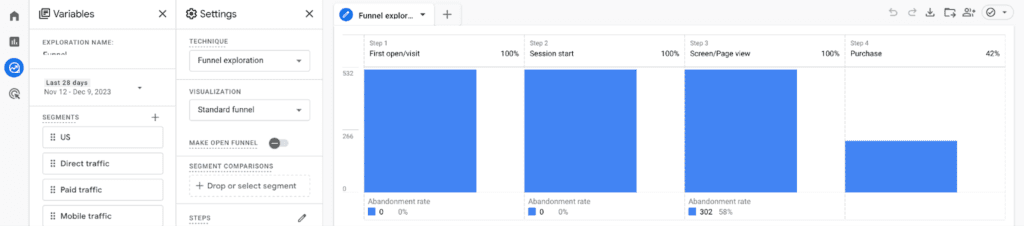
Create completely custom funnel reports, and add them to your dashboard
If you go to the Explorations area in the dashboard and then select funnel reports, you can build your own custom funnel reports right in the GA4 dashboard. Then, you can save them to whatever section you like to review again and again.
What will you measure with Analytics?
While many loathe and lament the new GA4 layout compared to Universal Analytics, I hope that this has opened your eyes to the measurement possibilities, and encouraged you to explore the dashboard.
Now that you know exactly what you can measure and learn using Google Analytics, which metrics are you most excited to explore for your website? Feel free to drop a comment below, or discuss it further in the Facebook community.

By Hannah Martin
Hannah is a long-time SEO expert and website marketing strategist. She has been optimizing websites since 2010, and was previously VP of Operations at an SEO agency before starting her own SEO and web design business in 2016. She has worked with brands like Beyond Yoga, Gerber Childrenswear, Sanctuary Clothing, and dozens of small independent businesses helping them improve their SEO and build websites that work to grow their business. She's a Wordpress geek, Squarespace Circle member, and now shares her knowledge with others at TheSEOKitchen.com.